
Premium DOM Component
JavaScript Orthographic Earth
A global map of the world
 by Read Write Tools
| Abstract |
|---|
The JavaScript Orthographic Earth (JOE) web component renders an interactive map of Earth where an entire hemisphere is visible. Its viewing angle can be rotated and tilted by the user to show Earth from any point of reference. Data can be added to the map using network-friendly TopoJSON layers. Data points can be linked to external databases to allow users to explore spatial-based thematic patterns. Data layers can be styled using a declarative language for visual style sheets. |
Background
All global maps suffer from distortion. This is because maps are a 2-dimensional projection of a 3-dimensional Earth. Attempts to display the entire world on a single rectangular canvas suffer more acutely than maps that are limited to just a portion of Earth at a time.
As an example, the Mercator projection exaggerates the size of the polar regions. This makes Canada, Greenland, and Russia appear much large than Africa, and turns Antarctica into an unrecognizable shape.
Another alternative — commonly used in thematic maps — is the equi-rectangular projection. It has less exaggerated areas than the Mercator projection, but still suffers because it plots each latitude without regard for the shorter longitudinal distances of the polar regions.
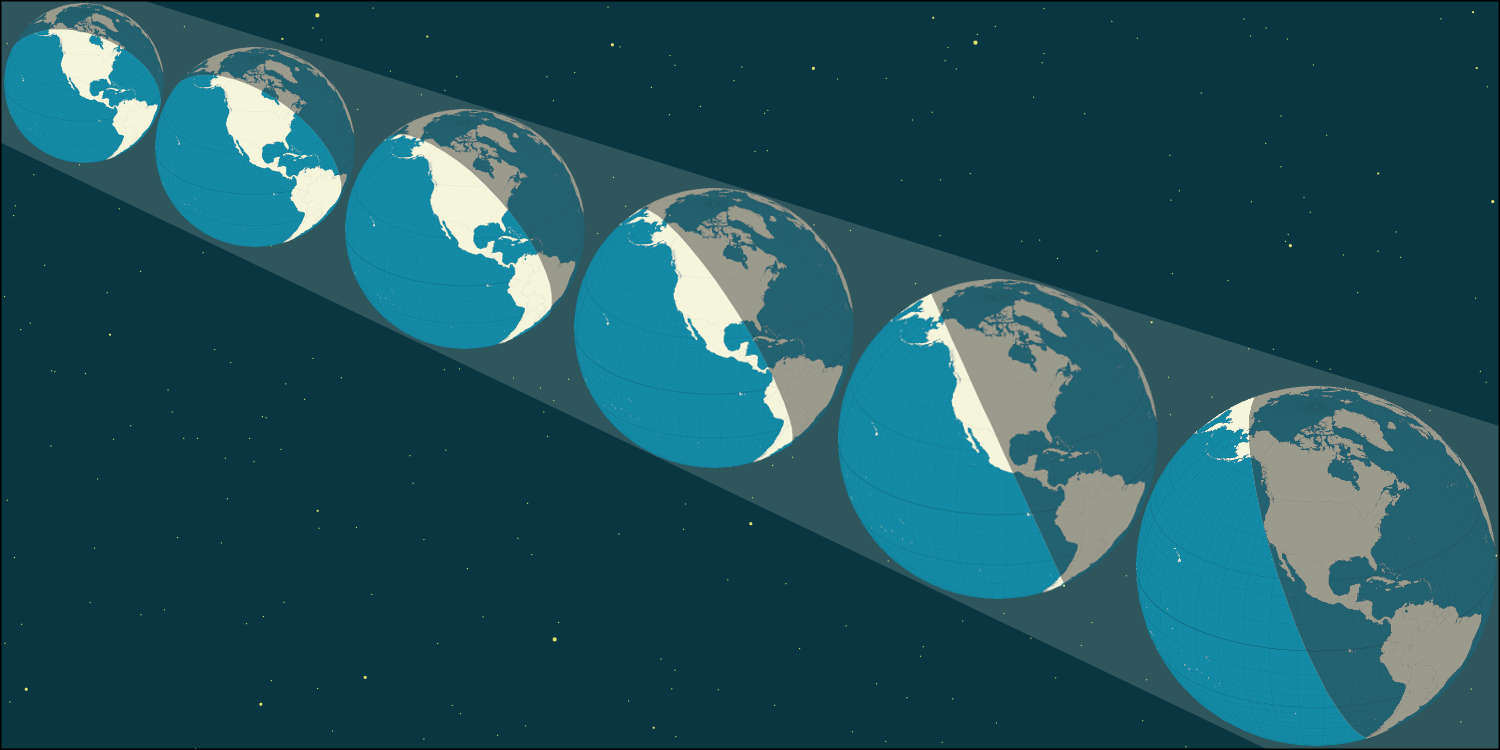
In contrast, the orthographic projection has faithful areas and angles near the point of perspective, with distortion occuring gradually, and only being noticable near the horizons. The primary drawback with orthographic projections in the past has been the fact that they only represent one-half of the world.
The JavaScript Orthographic Earth (JOE) web component provides an excellent alternative for cartographers who want to tell thematic stories on a global scale.
The JavaScript Orthographic Earth component has these features:
- The component can be used within any HTML document.
- The drawing can be resized to fit the device's screen size, allowing it to be used on both small cell phones and large mega-pixel monitors.
- The component is self-contained, which allows for the possibility of having two or more Earth drawings appear side-by-side on the same page.
- Data can be added to the map using TopoJSON packages having points, lines or polygons.
- The user interface supports both touchscreen and mouse gestures for scaling, translation, rotation and tilt.
- Users can locate and identify features by pointing to them.
- Webmasters can use the component's event-based interface to monitor user interactions, allowing synchronization with other parts of the HTML page.
- Features can be styled using a declarative visual stylesheet language.
In the wild
To see an example of this component in use, visit the timezone.earth website. To understand what's going on under the hood, use the browser's inspector to view the HTML source code and network activity, and follow along as you read this documentation.
Reference
| Documentation | READ WRITE HUB | |
| Source code | github | |
| Component catalog | DOM COMPONENTS | |
| Package installation | npm | |
| Publication venue | READ WRITE STACK |


